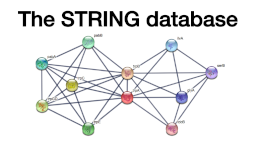
STRING exercises
Learning objectives
In these exercises, we will use the STRING database through its respective web interface. The exercises will teach you how to:
- retrieve a STRING network for a protein of interest or a list of genes/proteins from a high-throughput experiment
- interpret the different visual representations
- inspect the evidence behind an interaction
- understand the query parameters and customize searches
- inspect functional enrichment for a network of interest
Exercise 1
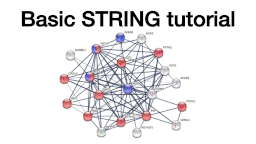
1.1 Single protein query
We will first retrieve a STRING network for human insulin receptor (INSR). Go to https://string-db.org/, open the Protein by name search interface, and type INSR in the field Protein Name. You can either specify Homo sapiens in the Organism field or leave it on auto-detect. Click SEARCH. You will first be presented with a disambiguation page, on which you can specify that the protein you are interested in is the human protein INSR, and press Continue to view the protein network.
Why are there multiple lines connecting the same two proteins?
1.2 Visual representations
The STRING web interface provides several different visual representations of the network and the Settings tab below the network view allows you to change between them. Try changing the meaning of network edges from the evidence to confidence views; do not forget to press the UPDATE button.
Which information is shown for the edges in each representation?
1.3 Evidence viewers
A key feature of the STRING web interface is the evidence viewers. One should not rely purely on the confidence scores; it is important to inspect the actual evidence underlying an interaction before relying on it, for example, for designing experiments.
Which types of evidence support the interaction between insulin receptor (INSR) and insulin receptor substrate 1 (IRS1)?
Further detail on the evidence of an interaction can be seen in a popup by clicking on the corresponding edge in the network. Click on the edge between INSR and IRS1 to view its popup; you may need to move the nodes to make this easier.
Which type of evidence gives the largest contribution to the confidence score?
Click on the Show button to view the experimental evidence for the interaction.
Which types of experiments support this interaction?
1.4 Query settings
In addition to the network view, the set of interactors can also be viewed in a tabular form. Change to the Legend tab and look at the table below the network.
How many functional partners are shown for INSR? What is the confidence score for the lowest scoring one?
Change back to the Settings tab. Increase the minimum required interaction score from 0.4 to 0.7 and the max number of interactors to show from 10 to 50. Press the UPDATE button to apply the changes. Go to the Analysis tab.
How many nodes do you have in the network? Which of the two settings now limits the number of nodes shown?
Exercise 2
In this exercise, we will work with the list of 541 proteins associated with epithelial ovarian cancer (EOC) as identified by phosphoproteomics in the study by Francavilla et al.. An adapted, simplified version of their results table can be downloaded here in TSV format and here in XLSX format. We recommend using Microsoft Excel, Numbers or a similar program to open the file. Alternatively copy the data into an online spreadsheet such as Google sheets.
2.1 Multiple proteins query
We will first retrieve a network for the proteins from the study. Go to https://string-db.org/, open the Multiple proteins search interface, and paste the list of UniProt accession numbers from the UniProt column (the first column) in the table into the field List Of Names. Specify Homo sapiens in the Organism field and click SEARCH. You will first be presented with a disambiguation page, on which you can verify that the proteins you entered are correctly mapped. Press Continue to view the protein network.
How many nodes and edges are in the resulting network?
2.2 Query settings
The Settings tab allows you to modify detailed parameters for the search, such as the network type, the minimum required interaction score, and the types of evidence to use (active interaction sources).
Change the minimum required interaction score to high confidence (0.700).
How does changing the confidence influence the set of interactions shown?
Change the network type from full STRING network to physical subnetwork. Do not forget to press the UPDATE button.
How does changing the network type influence the set of interactions shown in the network?
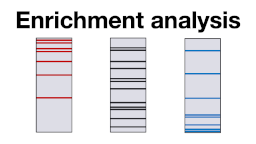
2.3 Functional enrichment
Another key feature of STRING is the provided network analysis, where one can find network statistics and functional enrichment computed for the network. Go to the Analysis tab below the network and look at the different enrichment categories (tables).
For how many categories do you see enrichment?
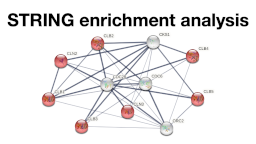
Look at the enriched KEGG Pathways and explore the table in more detail.
How many KEGG pathways are enriched?
Press on the first three KEGG pathways and you will see a color showing up next to each of them. Scroll up to the network view and find the proteins annotated by these pathways.
Do the pathways annotate the same set of proteins or not?
Supporting lectures
The theoretical background for these exercises is covered in these short online lectures:
Supporting literature
Szklarczyk D, Gable AL, Nastou KC, Lyon D, Kirsch R, Pyysalo S, Doncheva NT, Legeay M, Fang T, Bork P, Jensen LJ and von Mering C (2021). The STRING database in 2021: customizable protein-protein networks, and functional characterization of user-uploaded gene/measurement sets. Nucleic Acids Research, 49:D605–D612.
Abstract Full text
Doncheva NT, Morris JH, Holze H, Kirsch R, Nastou KC, Cuesta-Astroz Y, Rattei T, Szklarczyk D, von Mering C and Jensen LJ (2022). Cytoscape stringApp 2.0: Analysis and visualization of heterogeneous biological networks. Journal of Proteome Research, 22:637-646.
Abstract Full text
